

How much more are ~28,000 VERMONT ACA enrollees *really* paying this year due to Trump/GOP policies?
Wed, 07/01/2026 - 1:50pm
IMPORTANT: See the original post in this series for an explanation of the methodology.
Regular readers know that I've been obsessing over the massive increases in both gross as well as net premiums for ACA health insurance policy enrollees being caused by the combination of Congressional Republicans allowing the enhanced federal tax credits to expire as well as other Trump Regime policy changes for well over a year and a half now.
I've written countless analyses of how much both gross and net premiums skyrocketed from 2025 to 2026 across different states, different income levels and various other demographics...and recently it was confirmed that over 2.6 million ACA exchange enrollees had already been priced out of the market as of February, with the number almost certain to climb further throughout the rest of 2026.
As I've repeatedly warned, however, the increases in premium costs (whether gross or net) are only half the story. The other big shoe which is dropping this year is increased out of pocket costs as millions of the ~19.2 million or so remaining enrollees as of April have been forced to downgrade their coverage to avoid (or at least minimize) those massive premium spikes.
In most cases this means moving to plans with higher deductibles, higher co-pays & higher coinsurance costs. In many cases this has also included moving to plasn with worse networks, referral requirements to see specialists and so on.
With that in mind, that's exactly what I've decided to set out to do: Calculate the average year over year increase not just in net premiums (that is, how much more ACA enrollees are having to pay each month) but also the year over year change in average out of pocket costs.
Let's look at VERMONT:
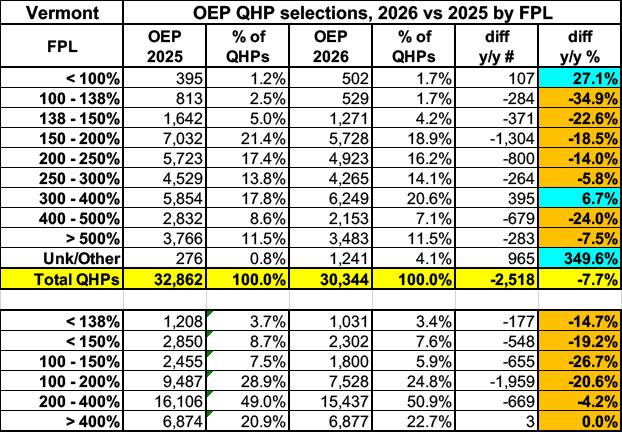
Here's a look at ACA exchange plan selections during Open Enrollment by household income level this year vs. last.
Like most states, Vermont has seen enrollment plummet across most income brackets. Oddly, they've seen an increase in enrollment of residents earning less than the federal poverty level (FPL), which is strange considering that the Trump Regime has ended subsidy eligibility for most legally-residing non-citizens...but that increase is only about 100 people, so perhaps it's just statistical noise.
Overall, plan selections have dropped by 7.7%, or over 2,500 people versus OEP 2025, which is a small number but a high percentage given the low population of the state.
Onto the main analysis:
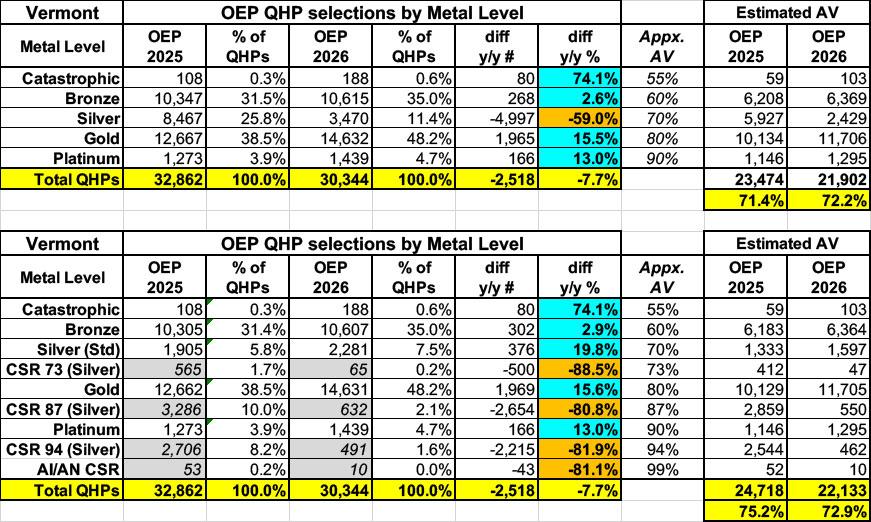
Here's total Open Enrollment plan selections for both 2025 & 2026 broken out by Actuarial Value (AV) category. The first table is based on official metal level tiers, but it's the second table which is critical, since a huge chunk of ACA enrollees are usually enrolled in CSR Silver plans (which include Cost Sharing Reduction assistance). CSR assistance dramatically boosts the AV of Silver plans up to Platinum levels in most cases.
Unlike most states, Vermont's shift in enrollment by metal level/actuarial value category is a bit of a mixed bag, likely because of a combination of Premium Alignment pricing and their own state subsidy program, Vermont Premium Assistance, which reduces monthly health insurance bill by 1.5% of total household income for households earning up to 300% FPL.
For example, if a family of four earns $70,000/year (217% FPL), Vermont's supplemental subsidies would chop an additional $1,050 off their net premiums.
However, this makes less difference this year than you might think since, unlike some states which either newly implemented or beefed up existing subsidy programs, the VPA program is essentially unchanged from last year.
In any event, the average actuarial value of Vermont enrollees still dropped a bit, from 75.2% to 72.9%.
By combining these numbers with the average gross premiums per enrollee I'm able to calculate an estimate of the average total medical expenses each enrollee racks up each year assuming an 80% average Medical Loss Ratio (as I stated in the original post, this can vary widely by carrier and year, so should be considered a very broad average only), which looks like so:
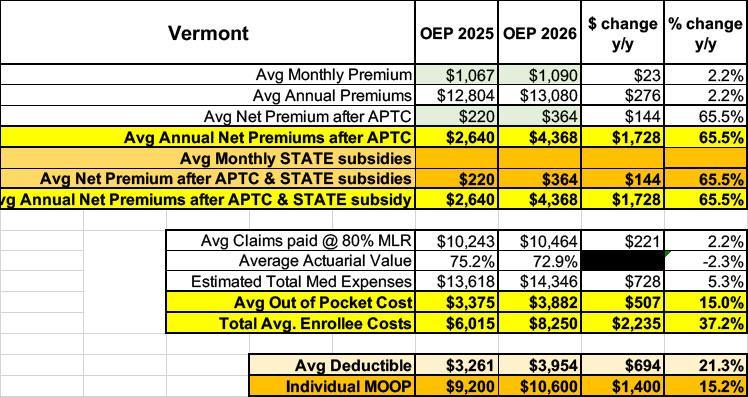
UNFORTUNATELY, unlike most states with their own state subsidy program, I haven't been able to pin down exactly how much average VT exchange enrollees receive in state subsidies, so everything below this has to be taken with that grain of salt.
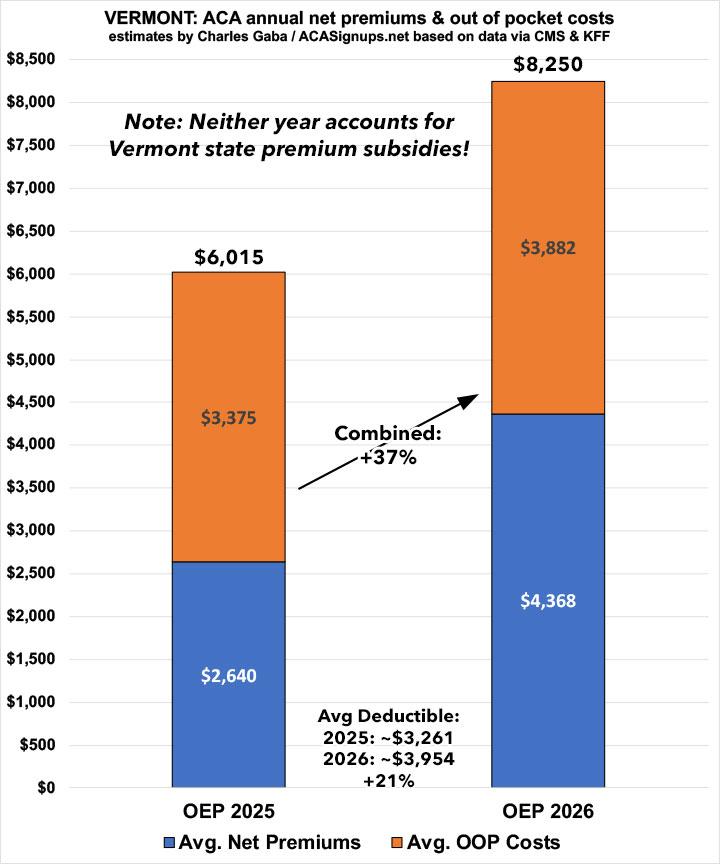
Average net premiums jumped by 65% year over year from $220/month to $364/month on average (again, before state subsidies either year).
In addition, by my best estimates, average out of pocket expenses shot up by 15% as well.
Combine the two and you're looking at an estimated per enrollee healthcare expense hike of ~37%, or over $2,200 apiece this year. (again, not taking state subsidies into account either year).
In addition, based on KFF's net data, average deductibles also increased by ~21% to over $3,900 for single coverage this year, and the maximum (theoretical) out of pocket cut-off for all ACA enrollees went up by over 15% this years as well, to $10,600 for single coverage.
Next up: VIRGINIA.
Advertisement
